
Is your software development team producing business features fast enough? Does it ever feel like development is stalling, even though your teams are busy? When software systems don’t appear to grow as quickly as expected, the reasons can be surprisingly complex. That’s where software metrics come in. They help managers and executives ask sharper questions earlier, and based on real data, rather than gut-feel.
By Jan Willem Klerkx, CEO, BonCode
Churn vs. growth – your window into team effectiveness
At BonCode, one of the most valuable things we’ve learned is that software metrics don’t just reveal the health of your codebase, they often expose patterns in your software development and requirement setting process. Let me give you a simple example.
Some time ago, I was looking into some trends of some metrics of a client’s codebase. The system had grown steadily but modestly, reaching about 70,000 lines of code with a team of 10 developers. On the surface, that seemed fine. But then I looked at another metric: churn.
Here’s the graph I was looking at:
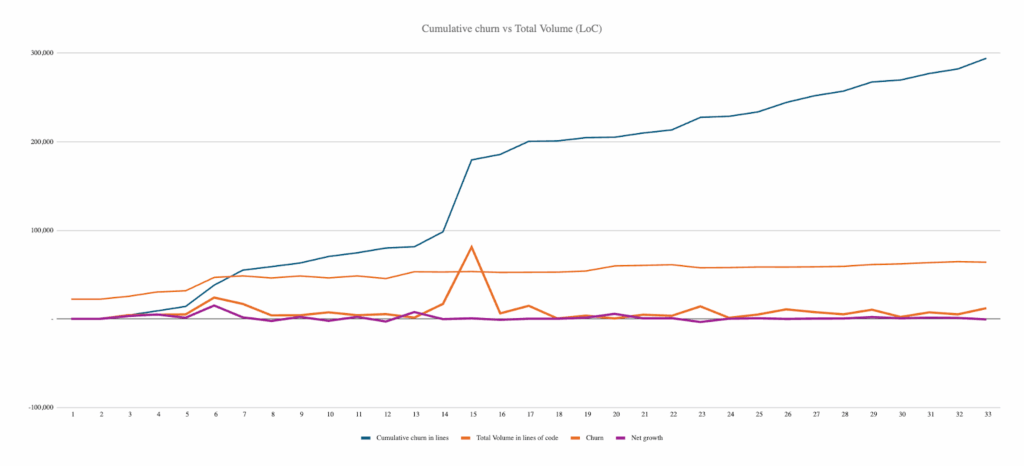
Churn (blue line) measures how many lines of code are touched – added, edited, or deleted – over time. Think of it as the number of building blocks being moved around. Churn relates to activity.
What I saw was striking: developers were touching hundreds of thousands of lines of code (they were very active), but the total volume of lines of code (orange line) hardly changed and became approximately 70,000. The net growth of the system (purple line) stalled. While being very active, there was maybe not so much real progress.
If these people were building a wall, you’d expect the number of bricks they touched to match the wall’s growth. But here, it was as if bricks were being moved around endlessly, with very little added height to the wall.
That kind of imbalance is a red flag. Or at least an interesting starting point for delving into what’s going on.
What do high churn rates say about your process?
A large disparity between churn and net growth can mean many things. In my experience, it often signals inefficiency. Especially in projects that are building a new software system from scratch, you’d expect that churn somewhat equals growth of volume.If this is not the case then developers may be spending too much time refactoring for a number of reasons:
- Struggling to get approval for new features, so changes stall in cycles of review
- Operating under an imperative to ‘keep it small’ which discourages growth
- Scrapping new code too often due to unclear requirements or shifting priorities
- Avoiding bloat or misunderstanding a legacy codebase
None of these scenarios are purely technical issues. They’re organizational ones. And they all come with a cost. When developers touch 200,000 lines of code, but the system grows by only 5,000, that’s an expensive way of making progress.
From metrics to meaningful questions
This is why churn vs. growth is so powerful as a metric. It doesn’t tell you exactly why inefficiency exists, but it highlights when to ask better questions.
- Are teams unclear on what to build?
- Are product owners hesitating on approvals?
- Are developers locked in cycles of perfectionism?
By framing the data this way, software leaders can move from hunches to evidence. Instead of saying, “It feels like we’re not getting anywhere,” you can say, “We touched 10,000 lines of code, but only 500 made it into production. What’s going on here?”
The bigger picture
Of course, the goal isn’t to maximize code size for its own sake. Lean, maintainable systems are always preferable to bloated ones. But when churn and growth are badly misaligned, it’s worth investigating. You may have uncovered an organizational bottleneck, not just a technical one.
At BonCode, we see these simple metrics as conversation starters. They open up discussions between developers, managers, and executives about effectiveness, cost, and alignment. And sometimes, those conversations are more valuable than the data itself.
So, next time your team seems busy, but progress feels slow, ask yourself this question: Are we building new walls, or just rearranging the bricks?
Want to increase the ROI of your codebase? Get the insights you need from BonCode.


