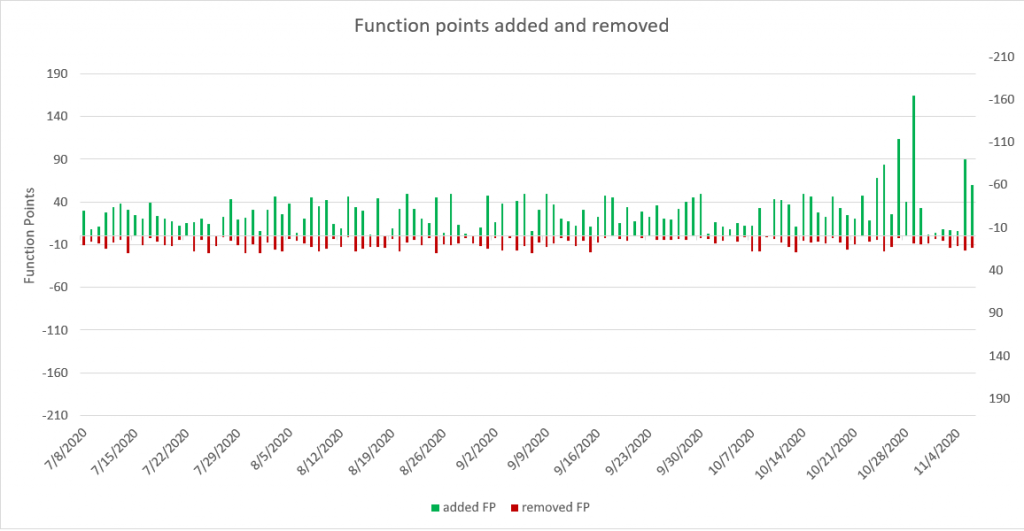
Even though the technology and methods exist for over almost half a century now, Function Point Analysis (FPA) is back. The rising popularity of FPA is no surprise. The world of low-code software languages might be the cause.
“High productivity claims by low-code platforms can be supported by fact-based results from Function Point Analysis.”
Several improvements have been made to the BonCode Function Point Analysis (FPA) processes. It now enables you to closely monitor the Productivity of your teams.
1. TRACK CHANGES & AFFECTED FUNCTIONALITY
This is the basis of the improved FPA. Over two measurements, one at time A and one at time B, we calculate the Functional Size through our static code analysis. The difference between these two measurements is plotted over time. We implemented a process that determines the weight of a change. Small changes shouldn’t count for as much effort as large changes. Next to this metric of Changed Functionality, BonCode also visualizes how much functionality is affected (in total and per iteration).

2. PINPOINT HOTSPOTS
The improved process tracks individual components of the system over time, and is therefore able to highlight the components that get a lot of changes. This is crucial information when you’re trying to pinpoint what parts of the system the team works on the most.
Below you can see a trend of a component that has seen a lot of changes in short time with three distinct spikes in activity. This visualization is useful for two reasons:
- We can create a meaningful discussion on why some components require more time than others.
- The spikes can be an indication of rework and requirements change. It begs the question: “Does it make sense that we are reworking this component?”

By summing the total amount of Enhancement Function Points we have a standardized measure that indicates total work done. This is very useful to determine team size for a project, or calculate the Productivity of your teams.


